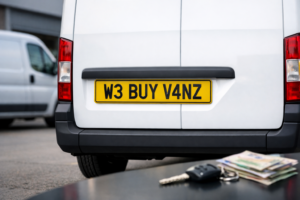

A van’s live market value isn’t a fixed number someone decided on a Tuesday morning. It shifts — sometimes daily — based on what buyers are actually paying right now, not what a price guide said three months ago. Understanding how that works helps you sell smarter, buy fairer, and avoid leaving money on the table.
What Is Live Market Van Valuation?
Live market van valuation is the process of pricing a used van based on real-time transaction data — actual sales happening right now — rather than a static figure from a periodically updated price guide.
Traditional price guides (think monthly or quarterly publications) work a bit like a weather forecast printed in last season’s newspaper. They tell you what the market looked like when the data was collected, not what it looks like today. Live market valuation, by contrast, pulls from a continuous stream of dealer listings, auction results, and completed private sales — refreshing constantly so the number you see reflects current reality.
This distinction matters enormously in a used van market that can move fast. When a shortage hits, when a sector booms, or when fuel prices spike, van values can shift in weeks. A static guide misses all of that.
How Van Prices Are Actually Set: The Data Behind the Number
Van prices are set by aggregating data from multiple live sources: dealer forecourt listings, online marketplace transactions, trade auction results, fleet disposal sales, and private sales. Algorithms weight these sources — typically giving more weight to completed transactions than asking prices, because what someone paid is more reliable than what someone hoped to receive.
Supply and demand signals feed directly into this process. If stock of a popular model like the Ford Transit Custom drops across the market, the algorithm detects the scarcity and the valuation moves upward — sometimes within days. Think of it like flight pricing: fewer seats available means the algorithm charges more, automatically.
Seasonality is baked in too. Panel van demand rises sharply in Q3 and Q4 as the e-commerce and delivery sector ramps up for peak trading. Luton vans see higher demand in spring and early summer when house moves peak. Live data captures these patterns as they happen, not after the fact.
Key Factors That Influence a Van’s Live Market Value
Several variables combine to produce any given van’s live valuation. Here’s what actually moves the number:
-
Age and registration year — vans depreciate differently to cars. A well-maintained commercial van often holds value better in later years because buyers care more about reliability than registration plate prestige.
-
Mileage — impact isn’t linear. Crossing key thresholds (around 100,000 miles is a significant one) can cause a disproportionate drop in value, even if the van is mechanically sound.
-
Van type and body style — panel vans, tippers, dropsides, Luton vans, and minibuses each have their own distinct market with different supply and demand dynamics. A tipper’s value doesn’t move the same way a panel van’s does.
-
Make, model, and parts availability — high-demand models with widely available parts (Ford Transit, Volkswagen Transporter, Mercedes Sprinter) hold value better because buyers trust ongoing running costs.
-
Service history, MOT status, and condition grade — a full service history can add meaningfully to value. Missing stamps or a borderline MOT will reduce it, and live valuation tools increasingly apply condition-grade adjustments automatically.
-
Payload capacity and Euro emissions standard — Euro 6 engines command a premium, particularly in cities with ULEZ or Clean Air Zone restrictions. A Euro 4 diesel van is worth considerably less in London than the same van in a rural area.
-
Geographic location — live data reveals genuine regional price variation. Vans sell for more in areas of high commercial activity. This is reflected in live valuations that use your postcode.
-
Number of owners and fleet versus private use — fleet-maintained vans often have more consistent service records, which buyers trust. Multiple private owners can signal a chequered history.
Live Market Van Valuation Tools and Software Explained
The main platforms used by the trade — CAP HPI, Cazana (now part of Motorway), and Glass’s Guide — all operate on live or near-live data feeds, pulling from thousands of data points daily.
Consumer-facing free tools give you a useful ballpark: enter your registration, mileage, and condition, and you’ll get a trade value, a retail value, and sometimes a part-exchange estimate. Trade-grade software goes deeper, offering confidence scores, days-to-sell predictions, and granular comparable data that professionals use to price competitively from day one.
If you want to understand what your van is actually worth right now, a good starting point is to get a live van valuation using your registration plate — it pulls live comparable data instantly and gives you a reliable baseline before you decide whether to sell privately, trade in, or go to auction.
Free consumer tools are genuinely useful for orientation. But if you’re making a significant financial decision — pricing a fleet disposal, setting an auction reserve — a paid professional platform with a full comparable report is worth the investment.
Reading a Live Market Van Valuation Chart
A live market van valuation chart shows the price trajectory of a specific van — filtered by model, age band, and mileage range — over a defined time period, typically 12 months.
Reading one is simpler than it sounds. A rising line means the market is short on that type of van and buyers are competing. A falling line means supply is outpacing demand or buyer sentiment is shifting. A flat line means the market is stable and pricing is predictable.
Here’s where it gets genuinely useful for sellers: charts reveal optimal timing. A 12-month chart for a Volkswagen Transporter T6, for example, typically shows a price uptick in late Q1 as tradespeople restart projects after winter. A Luton van chart often shows a spring peak ahead of removal season. A panel van chart frequently climbs into Q4 as e-commerce demand surges.
Sellers who read these charts can time their listing to hit the market when demand is rising — not after it’s already peaked. That’s the strategic edge most sellers never use, because they’re working from a static guide that can’t show them the trend at all.
Charts also reveal the gap between asking prices and actual transaction prices. If the average asking price is £14,500 but transactions are completing at £13,200, you know the market is negotiating hard — and you can price accordingly.
Live Van Valuation for Buyers: Getting a Fair Deal
For buyers, live market data is a negotiation tool. Before you view any van, run the registration through a live valuation tool. If the seller’s asking price sits significantly above the live retail value, you have a concrete, data-backed basis for negotiation — not just a hunch.
Know which benchmark to use. Retail value is what a dealer charges. Trade value is what the trade pays. Private sale value sits between the two. If you’re buying privately, retail value is too generous a benchmark for the seller; trade value is too harsh. Private sale value is the fair midpoint.
A van priced significantly below live market value isn’t always a bargain. It’s a flag. Cross-reference the valuation with the MOT history, mileage, and service records before assuming you’ve found a deal.
Timing matters for buyers too. If a chart shows a model’s price rising, waiting costs you money. If it’s falling, patience pays.
Live Van Valuation for Sellers and Traders: Pricing to Sell
Overpricing a van based on an outdated guide is one of the most common and costly mistakes sellers make. The van sits unsold, accumulates days-on-lot, and eventually sells for less than it would have if priced correctly on day one. Live data prevents this.
Professional dealers use live market van valuation software to price from the moment a van arrives in stock. They’re not guessing — they’re matching the market in real time and adjusting as conditions shift.
Fleet and leasing companies rely on live residual value data to forecast end-of-contract returns accurately. Getting this wrong by even a few hundred pounds per unit, multiplied across hundreds of vehicles, is a significant financial exposure.
If you’re selling privately, a live valuation report gives you something concrete to show a buyer who haggles. “The live market data puts this van at £X” is a far stronger position than “I think it’s worth £X.”
If you’re selling a Luton van, aim to list in February or March — before the spring removal season peaks. For panel vans, late August to September catches buyers preparing for Q4 delivery demand. Timing your sale to the seasonal demand curve, visible in live chart data, can add hundreds to your final price.
Used Van Valuation vs Live Market Valuation: What’s the Difference?
A traditional used van valuation uses guide-book figures: broad category averages, updated monthly or quarterly, based on historical data. It’s reliable enough for a rough sense of value in a stable market.
Live market van valuation is granular, continuously updated, and reflects what buyers are actually paying today — not what they paid last quarter. The difference between the two can be marginal when markets are calm, and significant when they’re not.
During the semiconductor shortage of 2021–2022, used van prices surged dramatically. A traditional guide updated quarterly would have been thousands of pounds behind reality within weeks. Live data tracked the spike in real time. That gap — between what a guide says and what the market is doing — is exactly where sellers lose money and buyers overpay.
How External Market Forces Move Van Values in Real Time
Van values don’t exist in a vacuum. Several external forces move them continuously:
New van supply constraints — when manufacturers can’t build enough new vans (due to semiconductor shortages or production disruptions), buyers flood the used market, pushing prices up. Live data captures this immediately.
The electric van transition — as electric van adoption grows, diesel van residuals are under pressure, particularly for older Euro 5 and Euro 4 engines. The effect is already visible in live valuation data for high-mileage diesel vans.
Economic sector activity — construction booms drive tipper and dropside demand. E-commerce growth drives panel van demand. These sector signals feed directly into live van pricing.
ULEZ and Clean Air Zone expansion — a diesel van that’s worth £9,000 in Manchester may be worth meaningfully less in inner London if it doesn’t meet the local emissions standard. Live tools that use your postcode reflect this regional variation.
Interest rate changes — higher rates make finance-driven purchases more expensive, which softens buyer demand and can put downward pressure on retail van prices over time.
How to Get the Most Accurate Live Market Van Valuation
Gather your van’s details
You’ll need your van’s registration number (VRM), current mileage, and an honest assessment of its condition — excellent, good, average, or poor. Have your service history to hand; it affects the result.
Run a live valuation using your VRM
Enter your registration into a live valuation tool. The VRM lookup pulls your van’s make, model, age, and spec automatically, then matches it against live comparable data. You’ll typically see a trade value, a retail value, and a private sale estimate.
Cross-reference with at least one other tool
No single tool is infallible. Running your registration through two platforms gives you a confidence range — say, £11,800 to £12,400 — which is more useful than a single number. If the two results diverge significantly, investigate why.
Check live listings for real-world sense-checking
Search for your van’s make, model, age, and mileage on the main marketplace platforms. What are similar vans actually listed for? Remember: listed price isn’t transaction price. Assume some negotiation discount.
Consider a physical appraisal if the stakes are high
For high-value vans, fleet disposals, or auction reserves, a digital valuation is a starting point — not the final word. A physical appraisal by a qualified professional accounts for condition nuances that an algorithm can’t see.
Keep your service history, MOT certificates, and any receipts for recent work. These documents shift your condition grade upward and can be the difference between a buyer accepting your asking price or not.
Common Misconceptions About Live Market Van Valuation
Misconception 1: “A higher mileage van is always worth less.”
Not always. A 120,000-mile van with a full, stamped service history and recent timing belt replacement can be worth more than an 80,000-mile van with no history and a patchy MOT record. Condition and provenance matter as much as mileage.
Misconception 2: “Live valuation tools all give the same answer.”
They don’t. Different platforms weight their data sources differently, use different comparable pools, and apply different condition adjustments. Treat any single valuation as one data point, not gospel.
Misconception 3: “My van’s value is fixed until I decide to sell.”
It isn’t. Your van’s live market value changes as the market changes — even while it’s sitting on your driveway. A model that’s suddenly in short supply will be worth more next month than it is today. Timing genuinely matters.
Why Live Market Van Valuation Matters
For sellers, it’s the difference between pricing with confidence and guessing. For buyers, it’s the difference between paying a fair price and overpaying. For fleet managers and traders, it’s the foundation of every pricing, disposal, and acquisition decision.
The sellers who get the best prices aren’t the ones with the best vans. They’re the ones who understand what the market wants right now — and time their sale accordingly.
- Live market van valuation uses real-time transaction data, not static price guides, so the number reflects what buyers are actually paying today.
- Multiple factors move a van’s live value: mileage thresholds, Euro emissions standard, body type, location, and service history all play a role.
- Live valuation charts reveal seasonal demand patterns — sellers who read them can time their listing to hit peak demand for their van type.
- Free consumer tools give a useful starting point; trade-grade platforms offer the granular data needed for high-stakes decisions.
- External forces — supply constraints, ULEZ expansion, economic sector activity, and interest rates — move van values continuously, and live data captures these shifts in real time.
Frequently Asked Questions
What is a live market van valuation and how does it differ from a standard van valuation?
A live market van valuation prices your van using real-time data from current dealer listings, auction results, and completed transactions. A standard van valuation uses guide-book figures updated monthly or quarterly — so it reflects past market conditions, not present ones. The difference can be significant during periods of rapid market change.
How often is live market van valuation data updated?
Leading platforms refresh their data continuously — pulling new listings and transaction data daily, sometimes multiple times per day. This contrasts with traditional guides, which update monthly or quarterly. In a fast-moving market, that frequency gap matters enormously.
Can I get a free live market van valuation online?
Yes. Several consumer-facing tools offer free van valuations using your registration number. They provide a useful ballpark — typically showing trade, retail, and private sale values. For professional or high-stakes decisions, paid trade-grade platforms offer more granular and reliable data.
What information do I need to use a live market van valuation calculator?
At minimum: your van’s registration number (VRM), current mileage, and an honest condition assessment. The VRM lookup retrieves your van’s make, model, age, and specification automatically. Having your service history to hand helps you select the right condition grade, which affects the result meaningfully.
Why does my van's live market value differ between different valuation tools?
Different platforms use different data sources, weighting methodologies, and comparable pools. One tool may weight auction data more heavily; another may lean on dealer listings. Neither is definitively right — which is why cross-referencing two or three tools gives you a more reliable confidence range than relying on a single result.
How accurate are live market van valuation reports?
Accurate enough to be a reliable guide, but not precise enough to be treated as a guaranteed price. Condition variables that an algorithm can’t see — a small crack in the dashboard, a recent clutch replacement — will affect what a buyer actually pays. Use a live valuation as a well-informed starting point, not a final figure.
Does van mileage or age have a bigger impact on live market value?
It depends on the van and the mileage band. For vans under 80,000 miles, age tends to be the stronger driver. Beyond key mileage thresholds — particularly around 100,000 miles — mileage has a disproportionate impact because it triggers buyer hesitation about reliability. A high-mileage van with a full service history will always fare better than one without.
How does ULEZ affect my diesel van's live market valuation?
ULEZ (Ultra Low Emission Zone) and Clean Air Zone restrictions reduce the practical usability of non-compliant diesel vans in affected areas, which suppresses their value — particularly in and around London. Euro 4 and older diesel vans are most affected. Live valuation tools that use your postcode reflect this regional pricing variation. If you’re selling a non-compliant van, targeting buyers outside restricted zones can help preserve your price.
What is the difference between trade value and retail value in a van valuation report?
Trade value is what a dealer or professional buyer would pay for your van — it’s the wholesale price, lower because the buyer needs room to make a profit on resale. Retail value is what a dealer would charge a consumer on the forecourt, including their margin. Private sale value sits between the two. When selling privately, retail value is too generous a benchmark for the seller; trade value is too low. Private sale value is the realistic target.
How do I use a live market van valuation chart to decide when to sell my van?
Look at the 12-month price trend for your van’s make, model, age, and mileage band. If the line is rising, the market is strengthening — selling soon makes sense. If it’s falling, selling quickly before further decline is wise. Look for seasonal peaks relevant to your van type: Luton vans typically peak in spring (removal season); panel vans peak in Q3–Q4 (e-commerce surge); tippers and dropsides often peak in spring when construction activity resumes. Listing just before a seasonal peak — not after it — gives you the best chance of achieving the highest price.